
Your town. A clearer picture.
How’s Stony Brook doing?
What are homes selling for, and how long are they taking? Here’s the local snapshot.
This report covers single-family houses. Looking for condominiums? Read the separate Stony Brook report ↗
Monthly editionsSeptember 2026 · Single-family homes
Request my town’s statsCall, text or email Kevin
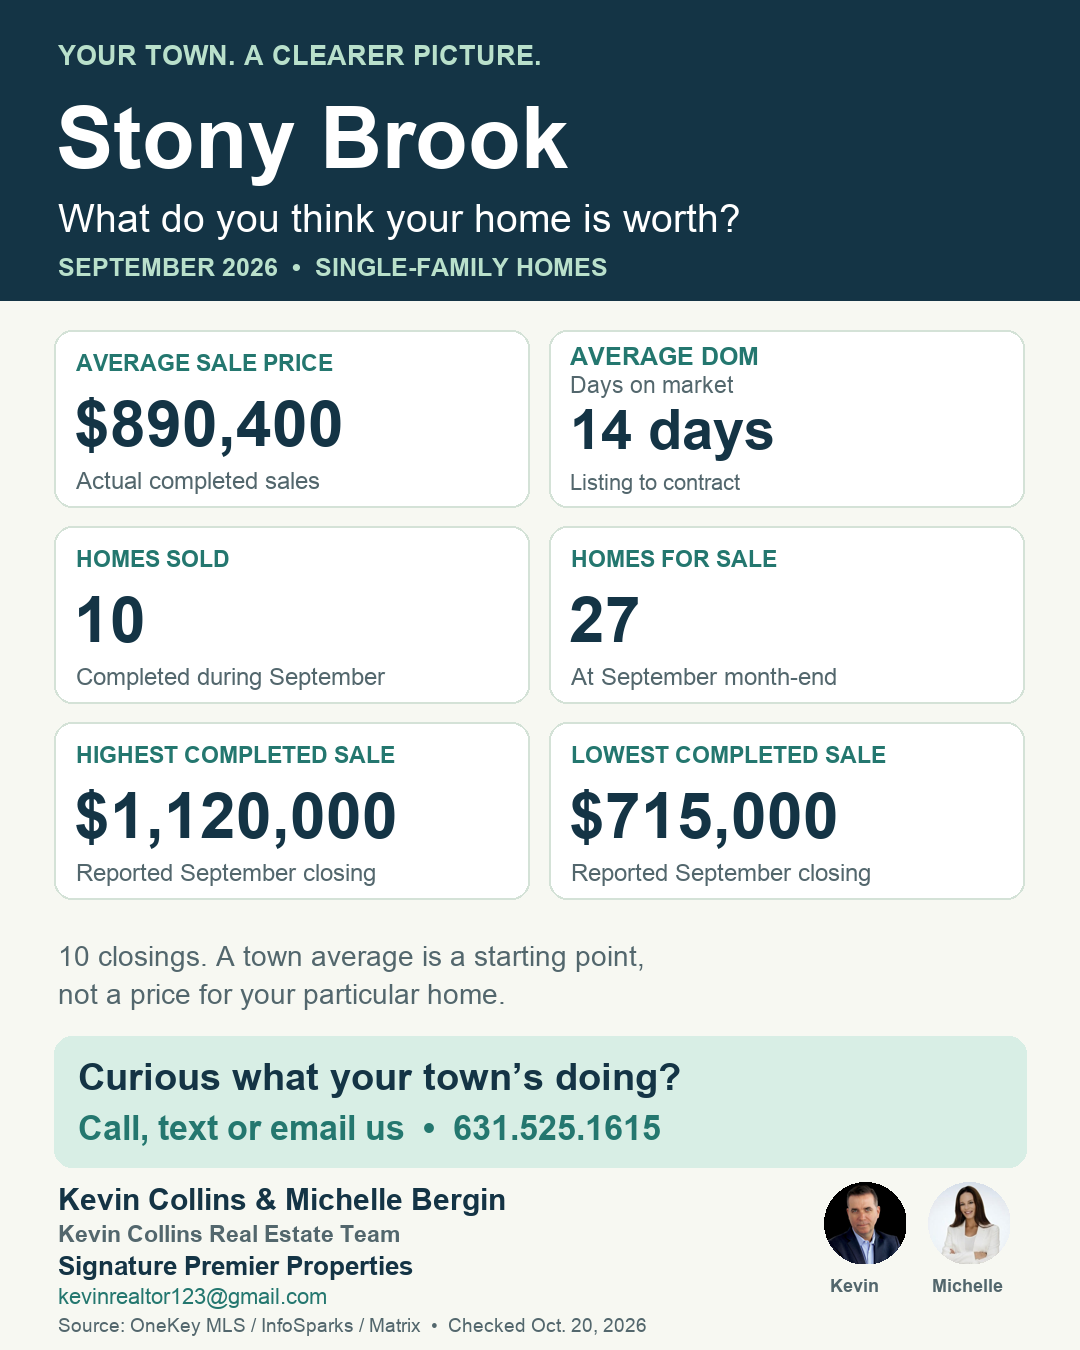
- Average sale price
- $890,400
- Average DOMDays on market
- 14 days
- Homes sold
- 10
- Homes for sale
- 27
Actual completed sales.
Listing to contract; separate pending-data sample.
Completed during September.
Active at September month-end.
10 completed sales. That’s a small monthly sample. The homes that happened to sell affect the average. Your home deserves comparisons that fit its location, size and condition.
Compare Stony Brook with Suffolk County ↓
The month’s completed sales
What was the sale-price range?
Highest completed sale
$1,120,000
Lowest completed sale
$715,000
Reported single-family closings in Stony Brook, September 1–30, 2026. Area-wide MLS data; these are not all our team’s sales.
What could it mean for your home?
Your home deserves its own look.
The offer-time measure uses pending data; it doesn’t guarantee your selling or closing timeline.
If a move has been on your mind, give me a call. Michelle and I can help you put the numbers beside your own plans.
Your town beside the wider market
Stony Brook and Suffolk County, side by side.
The same month and single-family filter. The county covers a wider mix of homes and places. Use it for context, then focus on the comparisons relevant to your property.
September 2026 · Single-family homes
September 2026 · Single-family homes
Average sale-price change versus September 2025: Stony Brook +11.5% · Suffolk County +1.7%. A different mix of sales can change this figure; it is not the change in every house’s value.
| Measure | Sep. 2026 | vs. Sep. 2025 |
|---|---|---|
| Average sale price | $890,400 | +11.5% |
| Median sale price | $880,000 | +16.6% |
| Average DOM — Days on market | 14 days | -33.3% |
| Median days to offer | 15 days | 0.0% |
| Completed sales | 10 | -9.1% |
| Month-end homes for sale | 27 | +3.8% |
Your home. Your questions.
Curious what your town’s doing?
Call, text or email us.
Thinking about selling, wondering what your home is worth, or working through a real estate question? You don’t need to have it all figured out. We’re happy to help.


Kevin Collins & Michelle Bergin
Kevin Collins Real Estate Team · Signature Premier Properties
What’s behind the numbers?
Source: OneKey MLS, InfoSparks / MarketStats by ShowingTime; actual high and low completed prices checked in OneKey Matrix. Retrieved October 20, 2026. Period: September 1–30, 2026. Area-wide single-family-home data.
Definitions, geography and useful limits
- Area: the source’s Postal City / Post Office–Town area. It may differ from municipal, village, ZIP-code or school-district boundaries. All price ranges, sizes, bedroom counts, years built and sale types were included within the single-family-home filter.
- Average price: the arithmetic mean of eligible completed sale prices. The median is the middle price. Neither estimates a particular home’s value.
- Days to an accepted offer: the source’s days-on-market measure based on pending data. It uses a separate group from completed sales and does not measure time to closing.
- Homes for sale: active inventory at September month-end, not today’s live inventory.
- High and low: actual reported completed single-family prices for this month and area, not asking prices, all-time records or a suggested price range for your house.
- Year-over-year: September 2026 versus September 2025 under matching source filters. The mix of homes sold and small samples can change the average or median. The change is not the change in every home’s value.
- Sample: 10 completed sales in this town. Suffolk County had 1,053 completed single-family sales in the same month. County figures cover a wider mix of neighborhoods and homes.
- Reports are dated snapshots and can be revised by the data provider. Information is deemed reliable but is not guaranteed. This is not an appraisal or an automated home valuation.
Sharing it? Include the September 2026 period and this report’s link so people can read the definitions.